


|
|
Introduction to Turbulence Modeling Comparison with Experimental the Data for Backward Facing Step Flows In the section the rate-dependent model predictions are compared with the experimental data of Kim et al. and the algebraic model of Srinivasan et al.
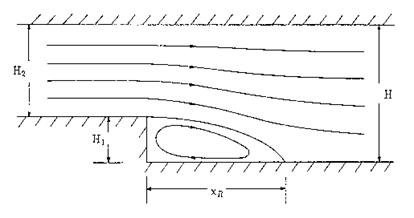
Schematics of the flow over a backward facing step.
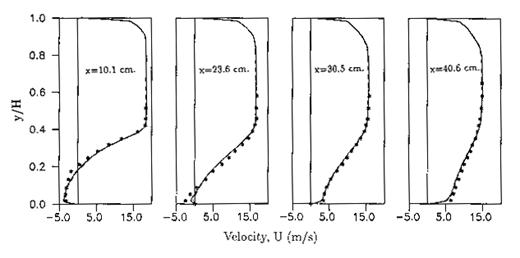
Comparison of the mean velocity profiles with the data of Kim et al. (1978). (Dashed lines are the model predictions of Srinivasan et al. (1983).
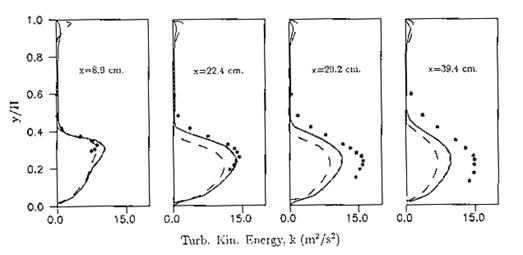
Comparison of the turbulence kinetic energy profiles with the data of Kim et al. (1978). (Dashed lines are the model predictions of Srinivasan et al. (1983).
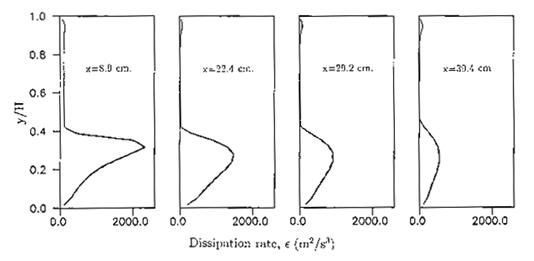
Comparison of the turbulence dissipation profiles. (Dashed lines are the model predictions of Srinivasan et al. (1983).
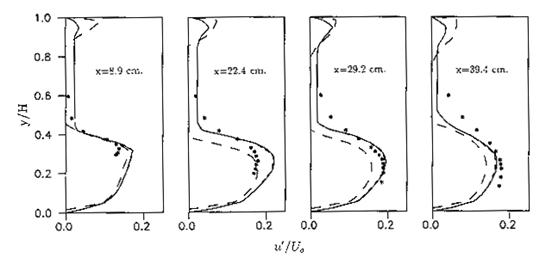
Comparison of the axial turbulence intensity profiles with the data of Kim et al. (1978). (Dashed lines are the model predictions of Srinivasan et al. (1983).
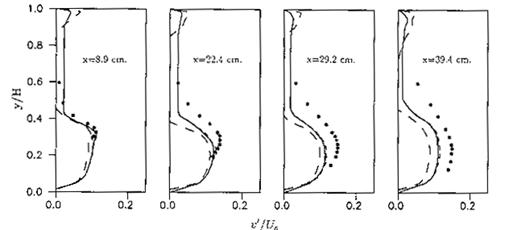
Comparison of the vertical turbulence intensity profiles with the data of Kim et al. (1978). (Dashed lines are the model predictions of Srinivasan et al. (1983).
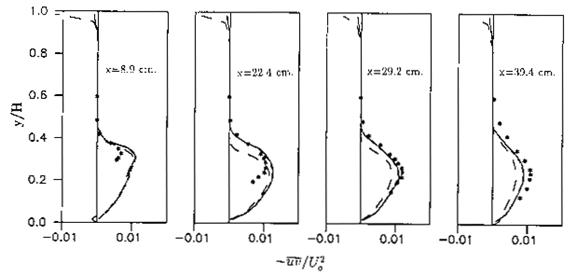
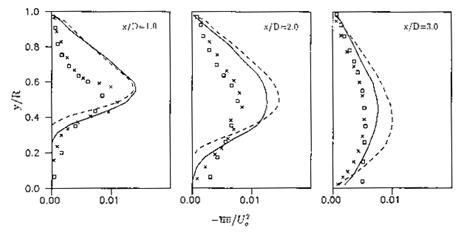
Comparison of the turbulence shear stress profiles with the data of Kim et al. (1978). (Dashed lines are the model predictions of Srinivasan et al. (1983).
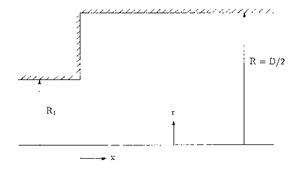
Schematics of the flow in an axisymmetric pipe expansion.
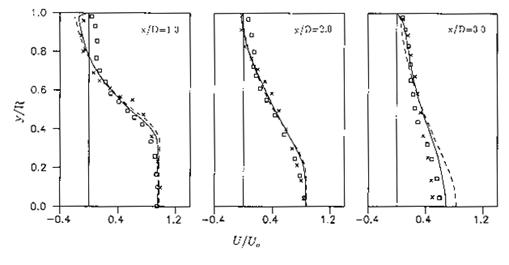
Comparison of the mean velocity profiles with the data of Junjua et al. (1982) and Chaturvedi (1963). (Dashed lines are the model predictions of Srinivasan et al. (1983))
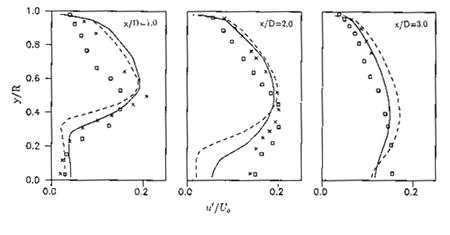
Comparison of the axial turbulence intensity profiles with the data of Junjua et al. (1982) and Chaturvedi (1963). (Dashed lines are the model predictions of >Srinivasan et al. (1983))
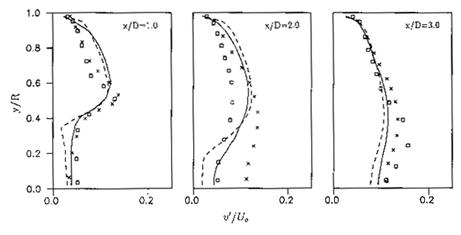
Comparison of the vertical turbulence intensity profiles with the data of Junjua et al. (1982) and Chaturvedi (1963). (Dashed lines are the model predictions of Srinivasan et al. (1983))
Comparison of the turbulence shear stress profiles with the data of Junjua et al. (1982) and Chaturvedi (1963). (Dashed lines are the model predictions of Srinivasan et al. (1983)) |
|
|