

|
|
Brownian Motions Example: Particle Dispersion and Deposition in a Viscous Sublayer (page 2 of 2) Ounis et la. (1991) performed a series of Lagrangian simulation studies for
dispersion and deposition of particles emitted from a point source in the viscous
sublayer of a turbulent near wall flow. Figures 5, 6 and 7 show time variation
of particle trajectory statistics for different diameters, for the case that the
point source is at a distance of 0.5 wall units away from the wall.
In these simulation it is assumed that when particles touch the wall they will stick to it.
At every time step, the particle ordinates are statistically analyzed and the mean,
standard deviation and the sample minimum and maximum were evaluated.
The points that the minimum curve touches the wall identify the locations
of a deposited particle.
Figure 5 shows that 0.05
Figure 5. Simulated trajectory statistics for 0.05
Figure 6. Simulated trajectory statistics for
0.03
Figure 7. Simulated trajectory statistics for 0.01
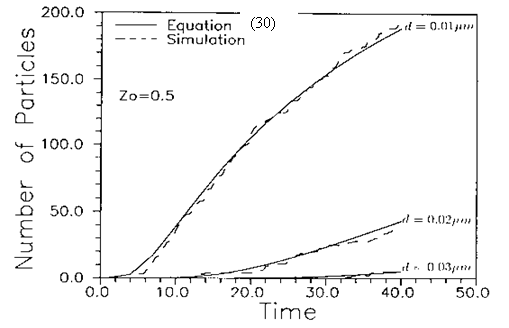
Figure 8 shows variations of the number of deposited particles,
It is seen that the Brownian dynamic simulation results and the diffusion equation analysis are in good agreement for the range of particle diameters studied. Figure 8 also shows that as the particle diameter decreases, the number of deposited particles increases sharply. Additional results (not shown here) indicate that the deposition rate decreases as the distance of source from the wall increases. Figures 4-8 show that the Brownian motion process is a significant mechanism for nano-particle diffusion and wall deposition.
Figure 8. Comparison of the simulated number of deposited particles with the diffusion model given by Equation (30). |


|


 particles
have a narrow distribution and in the duration of 40 wall units none of
these particle are deposited on the wall. As the particle diameter
becomes smaller, their spreading due to Brownian diffusion increases and a
number of particles reach the wall. For example, Figure s 6 shows that
five 0.03


 , with time for a point
source at a distance of
  wall
units from the wall. The solid lines in this figure are the exact solution for a
diffusion model given as

